Diagnose a Problem
- 3-1: Evaluate the Events via an Incident
- 3-2: Analyze the Calls
- 3-3: Confirm Your Diagnosis
- 3-4: Summary
In this section of the lab, you will learn how Instana can help you get to root cause of a problem in a quick and intuitive manner.
You can choose either one of the two virtual machines. Open the chrome browser to the Instana tab to run these exercises. If you are not already logged in, login using the credentials specified on the “accounts” tab in the browser.
3-1: Evaluate the Events via an Incident
On the left side, select “Events”
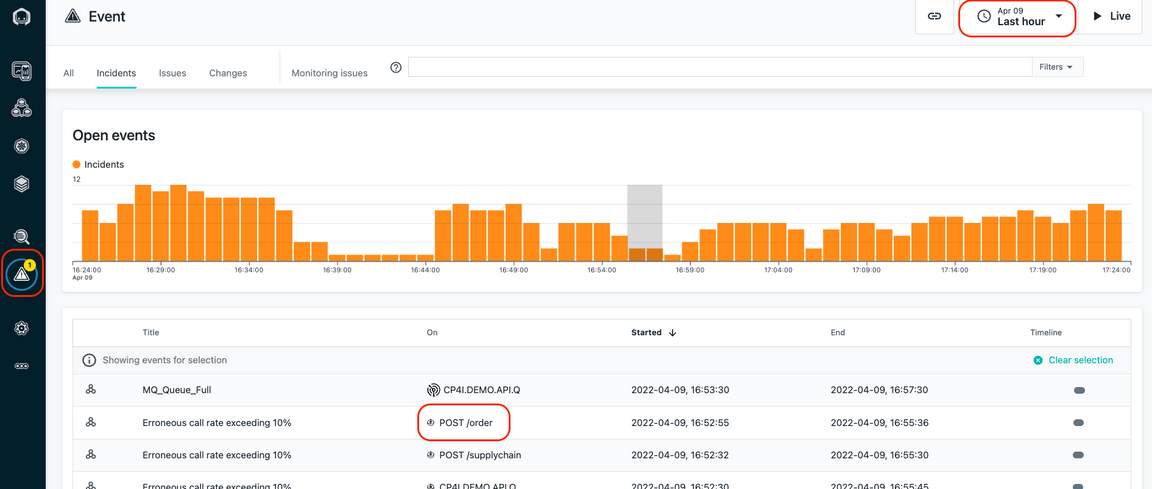
This will open up a panel showing all of the Incidents that are affecting the monitored systems and applications. Incidents are the raw Events that have been correlated via Analytics into an Incident.
Make sure that the time selection in the upper right corner is set to “Last hour”
As seen in the previous picture, select the Incident that is triggering on the “POST /order” request. You will notice that it is an Incident indicating that the Erroneous call rate exceeded 10%.
You will see the details related to raw Events that were correlated via analytics into an Incident.
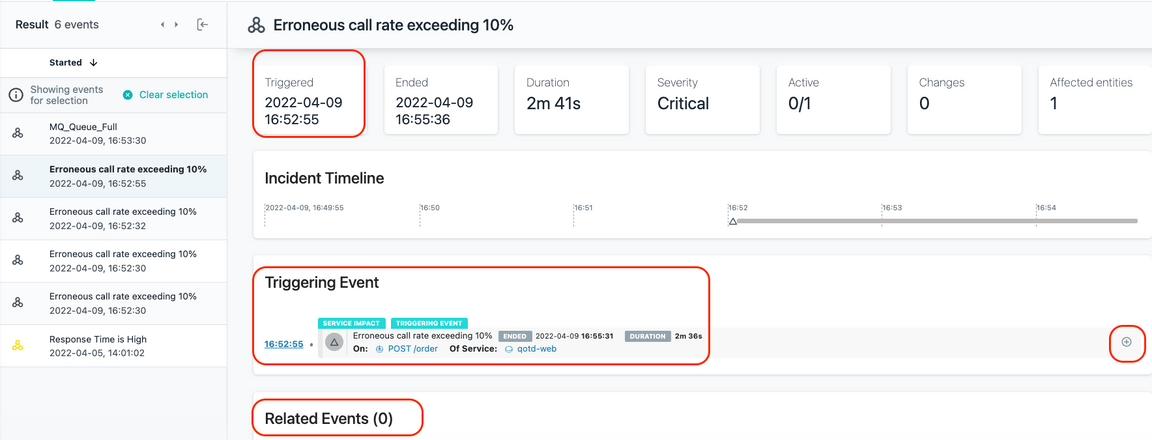
In this case, only a single Event makes up the Incident, but in many cases, you will see 10 or more Events that are related to each other contained within a single Incident.
Within the Incident, you can see when the Incident opened and in some cases, when it closed.
You will see the “Triggering Event” and any “Related Events”.
On the right side, click on the ”+” symbol to expand the Triggering Event.

You can see in the historical graph that the erroneous calls reached 100% for a period of time.

3-2: Analyze the Calls
Next, click the “Analyze Calls” button to analyze the calls.
You will be taken to an analytics screen where you can see all of the failed calls for “POST /order” . You can also see latency for the calls is greater than 2 seconds.
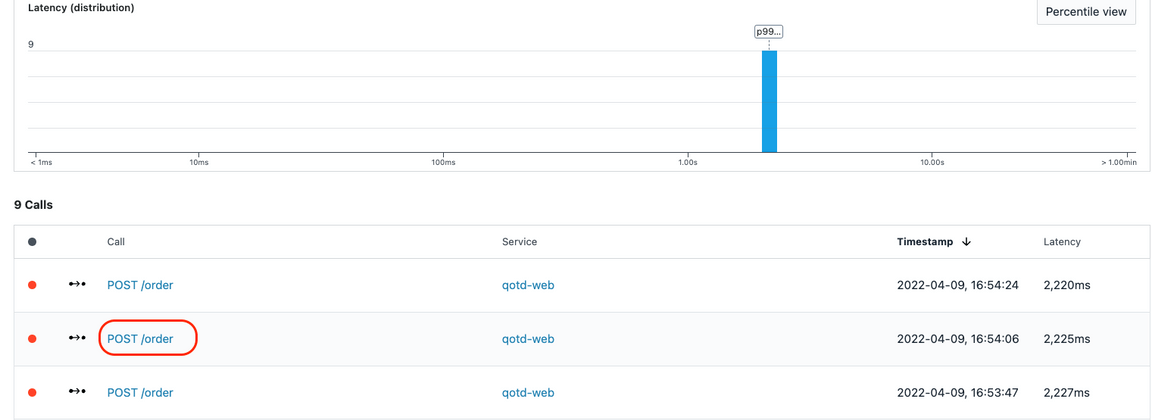
Select one of the “POST /order” calls
You will be taken to a screen where you can see the Call Stack and Stack Trace data. You explored this previously, but you did it with a good transaction. Now you are
examining a failed transaction.
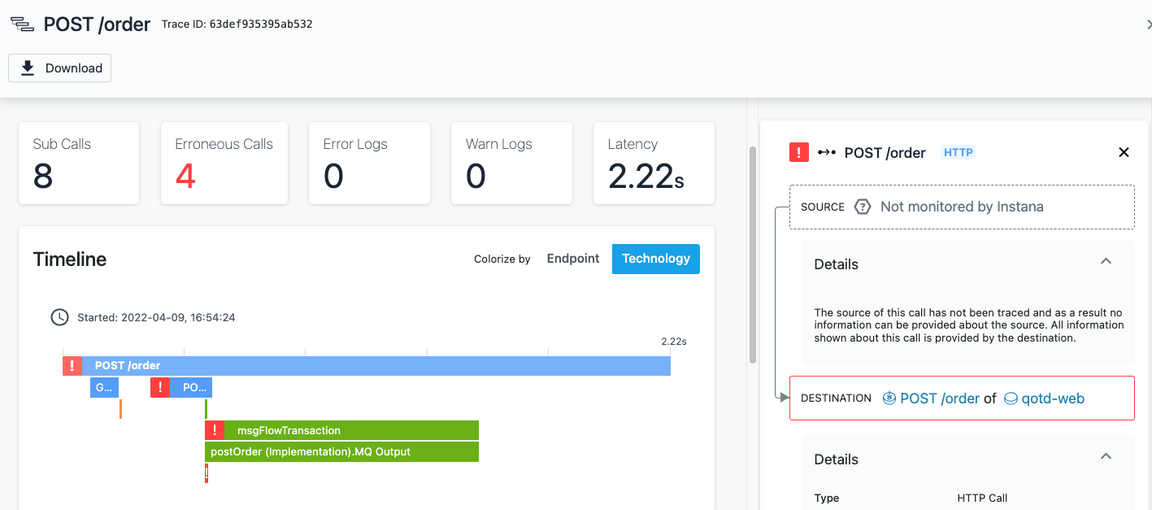
Scroll to the bottom of the page where you see the “Calls”

When you see errors, normally you go to the bottom of the call stack. That’s because the error in the last call is likely affecting the upstream calls.
Click on the last call and examine the information on the right side. Do this by clicking on the small green dot next the the word MESSAGING.
You will see the following error message: “IBM MQ call failed with compcode ‘2’ reason ‘2053”
This error message indicates that the MQ Queue is full and new messages can’t be put on the queue. In the future, Instana will be providing a translated error message for key messages like this so that you don’t have to lookup the error codes.
At this point, we believe we have a diagnosis for our problem. The MQ Queue is full and the transactions are failing because they can’t post a message to the queue.
3-3: Confirm Your Diagnosis
In many cases, you can confirm the root cause of the problem by analyzing the call stack and stack trace, but sometimes you need to investigate further.
In this case, you may want to examine the queue that is causing this error. Instana automatically puts a link to the queue in the lower right corner. For other technologies, there are similar links.
Now, scroll all the way to the bottom on the right side of the screen. You’ll see that there is a link that will link to the MQ Queue named CP4I.DEMO.API.Q. This is the queue that
is being used for this application transaction.

Click on the link to navigate to the queue details.
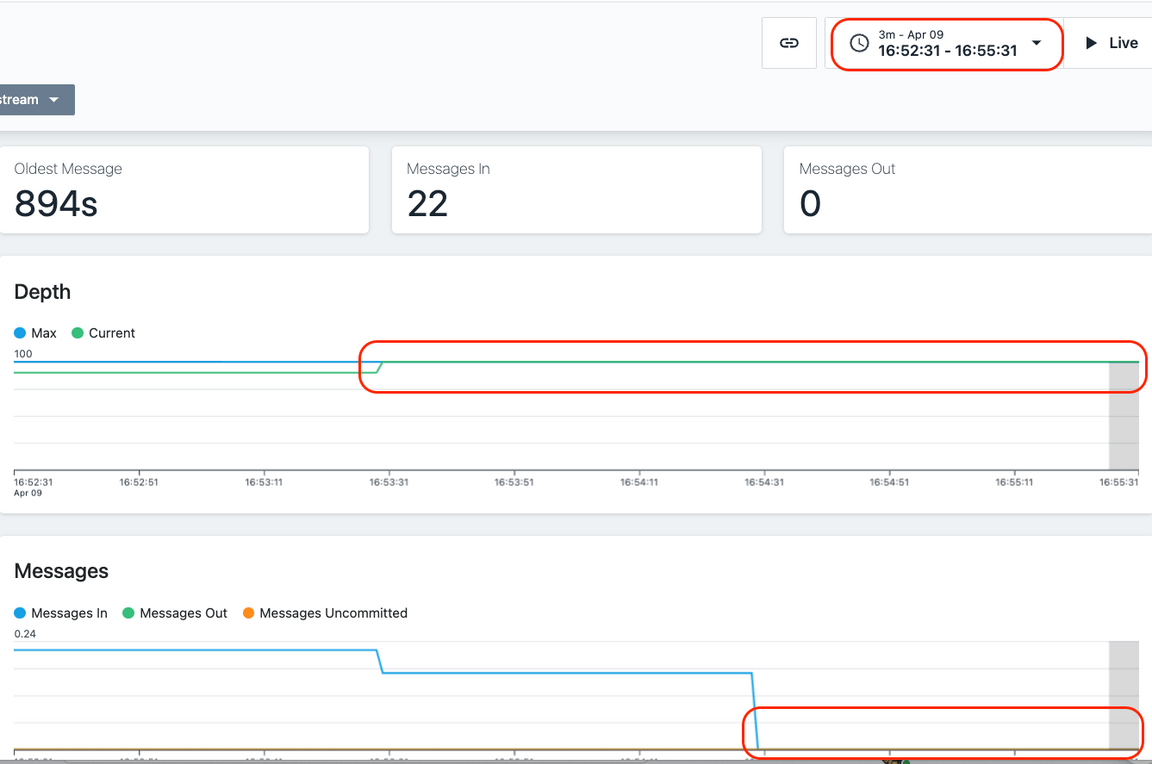
On this screen, you’ll notice a few important things.
- In the upper right corner, you’ll notice that the time range is specifically set to the timeframe when the Incident was open.
- The queue depth is at 100%
- No messages are going in or out of the queue.
Clearly there is a problem with this queue. The queue is full and transactions won’t work properly because new messages can’t be placed on the queue. We need to resolve the queue depth problem in order to fix the application.
That completes this section of the lab.
3-4: Summary
In this portion of the lab, you learned out to diagnose a problem in Instana. Ultimately, determining that the queue was full and preventing transactions from completing.
To continue other portions of the lab, select one of the lab exercises in the upper left corner or select one of the images below.
